2023-11-18
Real-Time Visualization: An Architecture for immediate insight

During a recent hack week, my team developed a proof of concept (POC) for a real-time visualization system showing how phishing emails find their way inside a target organization. I'll describe general architecture learnings that can be applied to any visualization that needs to be updated in Real-Time. The objective was to design and implement an architecture that fulfills the stringent requirements of real-time data visualization, using standard components offered by any cloud vendor like Postgres, Redis, a pub/sub bus, and a Data Warehouse.
Real-time Visualization Requirements
Real-Time visualization is a challenging task that demands a specific set of capabilities from the underlying architecture:
- Data Pre-Aggregation: To ensure responsiveness, data must be pre-processed and aggregated, reducing the computation needed at query time and data sent over the wire.
- Low Latency for Initial Queries: The system should respond swiftly upon the initial data request and every time the user changes filters to ensure a smooth user experience.
- Push New Data Differentials: As data changes, the system should be able to push to the frontend only the changes instead of the entire dataset to the client.
- Mutable Historical Data: There should be provisions for updating past data, such as retroactively syncing historical emails within a mailbox.
The Standard Analytics Architecture
Standard analytics pipelines built on top of Data Warehouses (like BigQuery or Snowflake) have:
- Hourly Rollup Delays: Standard practice often rolls up data hourly, introducing an inherent delay.
- No Pre-Aggregation: Typically, there is no pre-processing of data (besides Rollups) which leads to longer query times.
- Polling: Unlike our POC, traditional frontends must poll for updates rather than receiving push notifications. Polling is inefficient because requires to re-runing the query on the entire dataset.
- Absence of Differential Data: Traditional Analytics systems do not provide differential data when historical data changes.
I'm sure there are specialized systems out there that do a good job of supporting our requirements, but for this exercise, I wanted to compare a common solution that most companies are already using.
The Real-Time Analytics Architecture
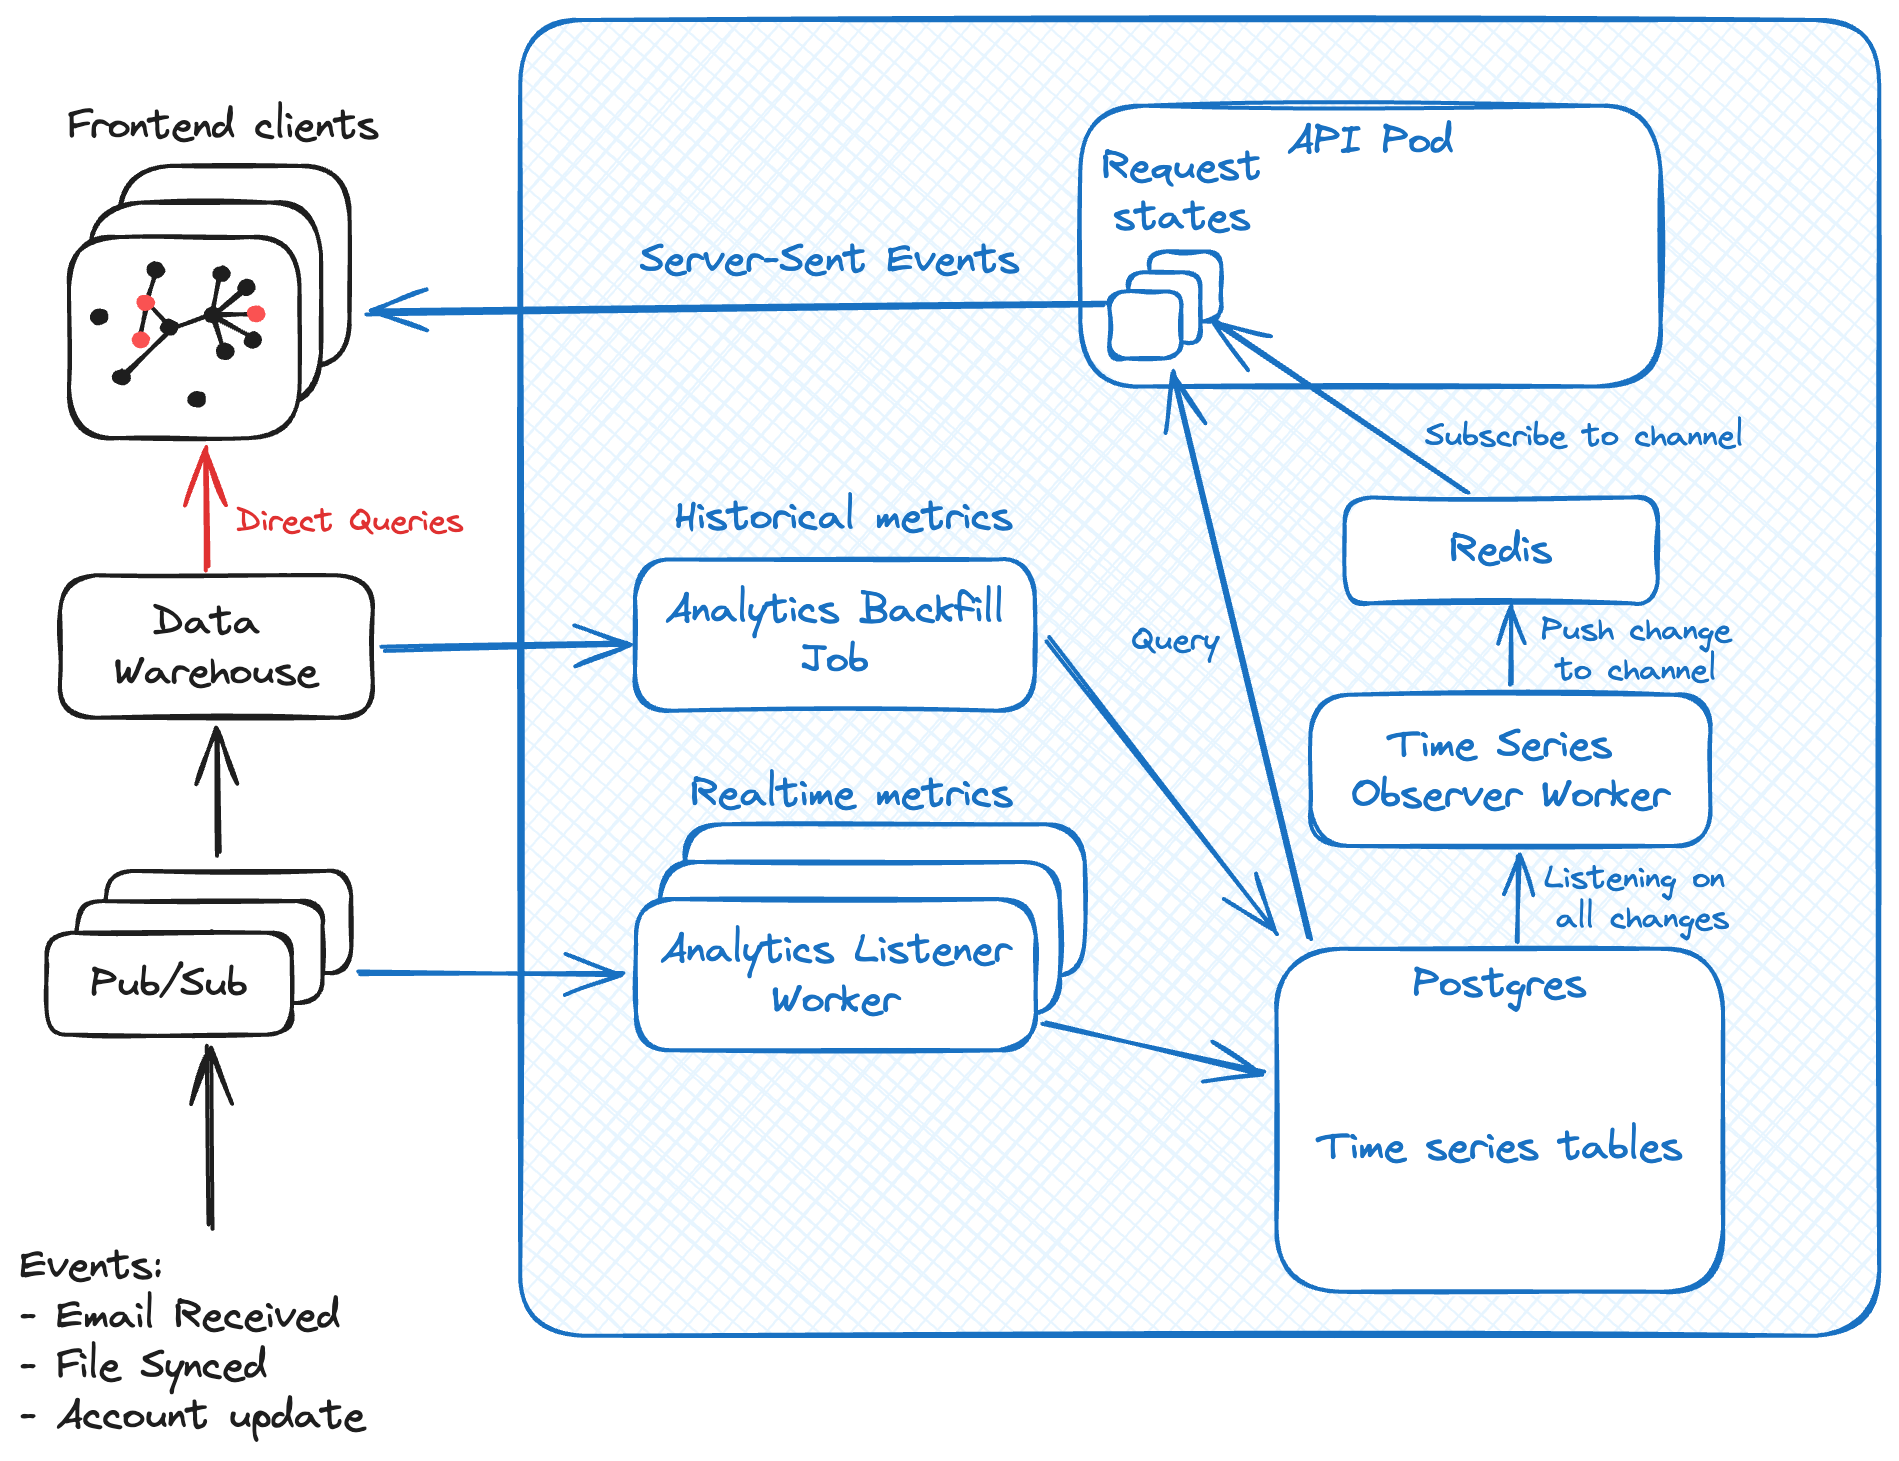
The architecture we propose leverages Postgres, Redis, and Server-Sent Events (SSE) to overcome the limitations mentioned above:
- Postgres stores pre-aggregated data in Time Series format in a table. It allows atomic transactional updates every time a Time Series requires an update. The time series are sharded per hour.
- Analytics Backfill Job constructs the initial Time Series by querying the Data Warehouse.
- Analytics Listener Worker subscribes to pub/sub and updates the corresponding Time Series bucket any time there are events. It reads a batch of events and updates the metric in Postgres.
- Redis manages scalable subscriptions observed by API pods, allowing for smart prefix subscriptions over different time intervals. The channels are sharded per hour.
- Time Series Observer Worker listens for changes in Postgres Time Series rows and communicates them to the corresponding Redis channel.
- API Pod is a container running the API handler code spawned up inside Kubernetes. Performs initial Time Series retrieval from Postgres and subscribes to Redis channels for updates.
- Server Sent Events: Maintains an open connection with the frontend to push differential updates every time the API pods observe a row change from the subscribed Redis channels.
Example Workflow
- When an email is received, the Email Syncer worker publishses a "new email" to pub/sub.
- The Data Warehouse writes the event into a historical email table.
- The Analytics Worker updates the Postgres Time Series "emails received".
- The Time Series Observer Worker notices that a Time Series changed in Postgres and publishes the changed table row to the Redis channel that corresponds to the hour.
- Redis informs the API pod observing the changed hour, which then sends the differential update to the frontend via SSE.
- The frontend updates the visualization with the new data.
Appreciating the System's Strengths
- Ultra-Low Latency: Millisecond response times are typical since the event is pushed to the different stages rather than pulled.
- Redis Scales well: Redis handles scaling gracefully and can handle hundreds to thousands of pods passively listening for changes, without adding load on Postgres.
- Robust Recovery Mechanisms: As long as the Data Warehouse has historical data, the system can recover swiftly.
- Reliable Data Retention: Pub/sub subscriptions keep data for days, minimizing the risk of data loss in case the Data Warehouse has an outage during event creation.
- Flexible Data Backfilling: New Time Series can be backfilled from the Data Warehouse, provided all events are captured.
Acknowledging the Limitations
- More Complex Architecture: It's complex to build and maintain this specialized architecture compared to just querying a Data Warehouse. The interplay between the Backfill Job and the Listener Worker is particularly delicate and difficult to get right.
- Persistence of SSE Connections: SSE requires stable connections. Not every Load Balancer is happy to keep a persistent connection with frontend clients. Additionally if an API pod crashes, the frontend would need to open a new connection with a separate pod.
- Scalability of Number Postgres Time Series: If the system requires thousands of metrics, the Postgres database may require sharding to scale. Potentially Postgres would need to be replaced by other more specialized Time Series databases.
Future Enhancements
- Diverse Data Structures: Expansion beyond Time Series to support sets and string arrays could enhance the system's capabilities.
- Increase Granularity: Current Time Series have a granularity of one hour, it's possible to decrease it to minutes or potentially seconds, accepting the fact that more data would need to be stored in Postgres and more frequent updates sent to the frontend.
Overall this was a fun little project. We had the POC working in 4 days. As next steps will be interesting replacing Postgres with AlloyDB and seeing if we can push performance further supporting a higher number of Time Series.